Ω OMEGA COMPASS
STRATEGIC GLOBAL OSINT SITREPs
A Human-Directed, Sovereign-Class, Recursive Multi-Sector Strategic Intelligence Research & Analytical Framework
— Strategic Foresight —
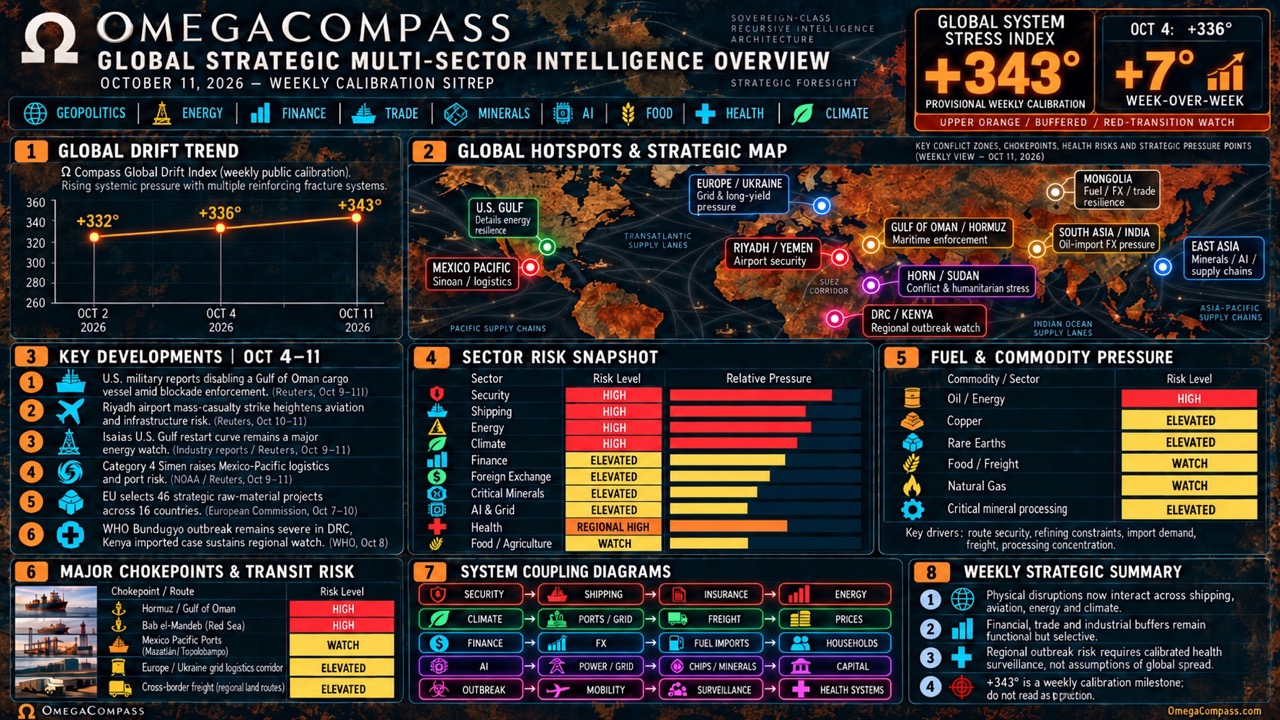
October 11, 2026 — Global 45° SITREP:
Gulf of Oman Blockade,
Riyadh Airport Escalation,
Dual-Hurricane Energy & Logistics Disruption,
Ukraine Winter Infrastructure,
Horn and South Asian Security,
Global Finance & Foreign Exchange,
Food Systems, Critical Minerals,
AI–Power–Grid, Global Health
& Mongolia Strategic Resilience
(+343°)
System: Ω Codex — Kintsugi Prime Sentinel
Subsystem: Ω Compass — Global 45° Strategic Intelligence System
Framework: Nonlinear, Pivoting, Multilayered Strategic Chessboard / Global 45°
Operational Drift Anchor: January 8, 2026
February 25 Public Baseline: 🟠 +298°
October 2 Continuity Anchor: 🟠 +332°
October 4 Weekly Calibration: 🟠 +336°
Current Strategic Drift: 🟠 +343° PROVISIONAL
Directional Bearing: ~64° ±10° ANALYTIC
Current State: Upper-Orange Systemic Convergence / Red-Transition Watch
Publication Mode: PUBLIC / OSINT-SAFE
Source Backbone: Ω Compass Intelligence Ledger & SITREP Archive
Executive Orientation
The global system remains in an
upper-orange Systemic Convergence Zone
while remaining short of generalized systemic breakdown.
The October 11 weekly Ω Compass calibration advances the
provisional Strategic Drift Index from +336° to +343°.
The increase reflects stronger interaction among
military security, maritime chokepoints, aviation,
energy, climate, logistics, sovereign finance,
foreign exchange, food systems, industrial processing,
critical minerals, AI and global health.
The central development is the transition from anticipated
transport disruption toward documented physical impacts
on commercial systems. U.S. Central Command reported disabling
a commercial vessel attempting to breach the Iran blockade
in the Gulf of Oman. Separately, Saudi authorities reported
mass casualties following a missile attack at Riyadh’s
international airport.
These developments compound existing exposure around
Hormuz, the Red Sea, marine insurance, energy exports,
airspace management and regional infrastructure.
At the same time, Hurricane Isaias has entered its recovery
phase after disrupting U.S. Gulf energy production,
while Hurricane Simon reached Category 4 intensity
near Mexico’s Pacific coast and the Manzanillo logistics gateway.
Financial conditions remain restrictive.
Long-duration sovereign yields, defensive cash positioning,
oil-import dollar demand and expensive capital
continue transmitting external risk into domestic
economic and industrial systems.
Additional fracture systems remain active:
Ukraine’s winter grid contest, Ethiopia–Tigray instability,
Pakistan–Afghanistan border escalation,
South China Sea strategic competition,
Korean Peninsula deterrence signaling,
and the humanitarian pressures affecting Sudan and Gaza.
However, the international system remains functional.
Strategic petroleum reserves, partial production recovery,
financial liquidity, trade accommodations,
alternative shipping arrangements and industrial
diversification continue providing stabilizing buffers.
🟠 +343° — PROVISIONAL RECALIBRATION
The +7° change reflects stronger observable pressure
across commercial maritime enforcement, aviation security,
energy recovery, climate disruption and risk-premium transmission.
The index is not classified as generalized red-system breakdown
because significant operational, economic and policy buffers
remain functional.
Strategic Drift Index:
🟠 +343°
Index State:
Upper-Orange Systemic Convergence /
Multiple Reinforcing Fracture Systems /
Red-Transition Watch /
Active Buffers /
No Generalized Systemic Breakdown.
Strategic Drift Continuity
| Continuity Anchor | Drift | Interpretation |
|---|---|---|
| January 1, 2026 | +265° | Initial elevated-system baseline. |
| January 8, 2026 | +278° | Operational calibration anchor. |
| January 22, 2026 | +284° | Cross-theater pressure continuing upward. |
| February 13, 2026 | +292° | Managed volatility and expanding infrastructure stress. |
| February 25, 2026 — Public SITREP | +298° | Advisory-dependent corridors and widening instability. |
| Late February 2026 — Continuity Ledger | +305° | Further escalation beyond the previous publication window. |
| October 2, 2026 | +332° | Multi-theater convergence across security, energy, finance and infrastructure. |
| October 4, 2026 — Weekly Calibration | +336° | Upper-orange convergence strengthened while buffers remained functional. |
| October 11, 2026 — Current Calibration | 🟠 +343° | Air-maritime security escalation, multiple physical-system shocks, restrictive financial conditions and continued strategic industrial exposure. |
No synthetic March–September monthly drift values are inserted.
Delta versus October 4: +7°
Delta versus February 25: +45°
Long-arc delta versus January 1: +78°
The October 4 public report and later October 4 calibration
are retained as separate continuity references.
Framework Overview
Layer Interaction Logic
Strategic drift improves meaningfully only when
physical reality and economic/financial plumbing
stabilize together.
Diplomatic statements alone do not produce de-escalation
when corridors, infrastructure, insurance, logistics,
capital markets and humanitarian systems remain under pressure.
Truth Sensors Used
Maritime throughput · commercial aviation ·
insurance pricing · military incident cadence ·
energy production and restart tempo · port dwell ·
grid restoration · rail throughput · sovereign yields ·
FX intervention · international reserves ·
food and fertilizer prices · mineral-processing capacity ·
compute/power/grid bottlenecks · cyber/ICS incidents ·
outbreak geography · humanitarian access.
Core Drift Rule Declaration
Peace signaling ≠ peace.
Selective throughput ≠ normalized corridor security.
Storm passage ≠ infrastructure recovery.
Trade agreement ≠ supply-chain independence.
Project designation ≠ productive industrial capacity.
Financial liquidity ≠ absence of risk.
Drift Bubble Legend
🟠 Elevated / Volatile
🟡 Threshold Watch / Mixed
🟢 Stabilizing / Positive Buffer
Global 45° Directional Bearing Analysis
The Strategic Drift Index represents accumulated comparative
system pressure. The directional bearing evaluates the
potential direction of geopolitical and economic fragmentation.
These are separate analytical constructs.
Inherited directional estimate:
~64° ±10°
This places the international system between
managed multipolar fragmentation and accelerated
strategic bifurcation, without establishing
irreversible hard-bloc separation.
| 30–90 Day Bearing | Judgmental Probability | Meaning |
|---|---|---|
| 35°–65° | 45% | Managed fragmentation with selective commercial and diplomatic cooperation. |
| 65°–90° | 35% | Accelerating coercive trade, security and industrial separation. |
| Above 90° | 8% | Harder strategic alignment and institutional incompatibility. |
| Below 35° | 12% | Meaningful reconvergence through lower security, energy and financial pressure. |
A jagged upward/sideways trajectory remains plausible:
selective de-escalation, renewed shocks,
alternative routing and industrial diversification
may occur simultaneously.
Probabilities are inherited judgmental scenario weights,
not actuarial estimates or statistically calibrated forecasts.
Strategic Drift Status — October 11
| Region / System | Current Condition | Primary Truth Sensor | Direction | Drift |
|---|---|---|---|---|
| Iran / U.S. / Israel / Gulf | Conflict and diplomacy overlap with direct blockade enforcement. | Military incidents, negotiations, naval posture, crude flows | ↑ | 🔴 |
| Hormuz / Gulf of Oman | U.S. forces reported disabling a commercial vessel attempting to breach blockade restrictions. | Vessel throughput, blockade encounters, insurance, tanker movements | ↑ | 🔴 |
| Red Sea / Bab el-Mandeb | Alternative Gulf export routes remain exposed to attacks and elevated marine-risk costs. | Insurance premiums, tanker routing, Yanbu loading, attack cadence | → High | 🔴 |
| Saudi Arabia / Yemen | Mass-casualty Riyadh airport attack increases aviation and strategic infrastructure exposure. | Airport restoration, flight schedules, airspace, retaliation | ↑↑ | 🔴 |
| U.S. Gulf Energy System | Isaias production shutdowns remain substantial despite early recovery and crew redeployment. | Production restart, refineries, ports, electricity, SPR delivery | ↓ From Peak | 🟠 |
| Mexico Pacific / Manzanillo | Category 4 Hurricane Simon threatens coastal and logistics infrastructure. | Storm track, port operations, power, roads, rail and verified damage | ↑ | 🔴 |
| Ukraine / Russia | Infrastructure and winter energy resilience remain central to the conflict. | Strike tempo, transformers, grid outages, repair crews, air defense | → High | 🔴 |
| Ethiopia / Tigray / Horn | Renewed Tigray warfare and regionalization risks remain significant. | Territorial control, Ethiopia–Eritrea relations, displacement | → High | 🔴 |
| Pakistan / Afghanistan | Repeated cross-border strikes create an elevated interstate-security dimension. | Airstrikes, border fighting, militant activity, diplomatic response | → High | 🔴 |
| Gaza / Israel | Reconstruction, humanitarian access and durable political settlement remain unresolved. | Aid access, displacement, rebuilding, security incidents | ↔ | 🟠 |
| Sudan | Severe displacement, hunger and humanitarian funding pressures persist. | WFP funding, IOM displacement, food security, aid throughput | → High | 🔴 |
| South China Sea | Close-contact maritime incidents and infrastructure expansion continue. | Resupply encounters, coast-guard operations, construction | → / ↑ Structural | 🟠 |
| Korean Peninsula | Hypersonic missile development and deterrence signaling remain elevated. | Missile tests, DMZ activity, nuclear posture, allied readiness | → Elevated | 🟠 |
| U.S.–China / EU–China | Tactical trade accommodations coexist with structural technology and mineral competition. | Tariffs, export controls, rare-earth licensing, manufacturing | ↓ Tactical / ↑ Structural | 🟡 |
| Global Finance / Credit | Elevated long yields and defensive liquidity increase capital costs. | Treasury yields, spreads, money-market flows, credit conditions | → High | 🔴 |
| Foreign Exchange | Energy-import dollar demand pressures major importers and emerging markets. | FX intervention, dollar demand, reserves, currency trends | ↑ Exposure | 🟠 |
| Food / Agriculture | Grain buffers coexist with elevated fertilizer, diesel and freight costs. | FAO index, USDA inventories, agricultural inputs | ↔ Mixed | 🟡 |
| Critical Minerals | EU diversification advances, while refining and separation remain concentrated. | Permits, financing, production, licensing, offtake | ↑ Capacity | 🟠 |
| AI / Compute / Power / Grid | Infrastructure expansion continues under more selective financing conditions. | Capex, grid access, semiconductors, power contracts, revenue | ↑ Structural | 🟠 |
| Global Health / Bundibugyo | Severe DRC outbreak with imported Kenya case and active contact tracing. | WHO geography, cases, laboratory confirmation, secondary transmission | → Critical Regional | 🔴 |
| Mongolia | Reserve and export buffers coexist with imported fuel and trade concentration risks. | Reserves, tugrik, fuel arrivals, border throughput, exports | ↔ Buffered / Exposed | 🟠 |
Multilayer Snapshot
Layer 1 — Physical Reality
Commercial vessel enforcement, airport attacks,
offshore production shutdowns, severe hurricanes,
infrastructure warfare and unresolved regional conflicts
define the physical-risk environment.
Layer 2 — Diplomatic / Narrative Theater
Diplomatic activity continues alongside coercive action.
Selective trade agreements and maritime transit
do not by themselves establish strategic normalization.
Layer 3 — Economic & Financial Plumbing
Energy and transport shocks increasingly transmit
into insurance, freight, inflation, foreign exchange,
sovereign yields and household costs.
Layer 4 — Alliance & Bloc Geometry
States increasingly hedge across commercial,
security and technology relationships.
Security alignments and trade partnerships overlap
without creating a single uniform global bloc.
Layer 5 — Information / Narrative / Verification
High-velocity incident claims, diplomacy,
ceasefires and investment announcements require
corroboration through independent sources and
verified operational outcomes.
Layer 6 — Technology / Industrial Capacity
AI, electricity generation, transmission, cooling,
semiconductors, critical minerals, capital markets
and industrial policy increasingly function as
one interconnected strategic system.
GRID → COOLING → MINERALS → CAPITAL → INDUSTRY
Cross-Domain Divergence & Coupling
| Trigger | Transmission Chain | Downstream Effect | Assessment |
|---|---|---|---|
| Gulf blockade + Riyadh attack | Security → shipping / aviation → insurance | Potential energy and travel risk premiums | 🔴 Reinforcing |
| Isaias recovery + Hormuz pressure | Production recovery versus maritime insecurity | Supply can recover while transport-risk costs remain high | 🟠 Divergence |
| Hurricane Simon / Mexico | Climate → ports → inland freight → trade | Potential Asia-facing supply-chain disruption | 🔴 Exposure |
| Oil costs + emerging-market FX | Energy → dollar demand → central-bank intervention | Financing and currency-management pressure | 🟠 Reinforcing |
| Grain stocks + fertilizer costs | Supply buffers versus agricultural input inflation | Mixed food-price signals | 🟡 Divergent |
| EU-China rare-earth licensing | Trade diplomacy → material access → industry | Short-term relief without structural independence | 🟢 Partial Buffer |
| AI expansion + high yields | Compute demand → power → capital costs | More selective project financing | 🟠 Selective |
| Bundibugyo + Mongolia prevention | Regional outbreak versus domestic health resilience | Different geographic health-risk trajectories | 🟡 Mixed |
Fracture-Point Master Matrix
| Theater | State / Allied Lane | Mainstream Lane | Independent / Technical Lane | What Is Actually Decisive | Drift |
|---|---|---|---|---|---|
| Hormuz / Gulf of Oman | Blockade enforcement, maritime access and diplomacy | Security incidents and shipping disruptions | Throughput, tanker tracking and insurance | Distinguish selective transit from strategic normalization. | 🔴 |
| Red Sea / Saudi Export Route | Alternative export corridor and defensive posture | Shipping-security risk | Tanker routing, pipeline flows and war-risk pricing | Alternative routes remain exposed to their own chokepoints. | 🔴 |
| Saudi Arabia / Riyadh Airport | Security response, civilian aviation and infrastructure protection | Mass-casualty strike and flight disruption | Airport restoration, schedules and airspace warnings | Attack cadence, restoration time and potential retaliation. | 🔴 |
| U.S. Gulf Energy | Storm response and emergency petroleum support | Production shutdowns and recovery | Platform restart and refinery/port operations | Production restoration versus physical damage. | 🟠 |
| Mexico Pacific | Hurricane response and port preparedness | Simon intensity and damage risk | NHC data and port/rail operations | Verified infrastructure damage and closure duration. | 🔴 |
| Ukraine | Resilience and infrastructure defense | Strike and retaliation cycle | Grid outages and restoration data | Strike tempo versus repair tempo. | 🔴 |
| Tigray / Horn | Territorial control and regional diplomacy | Renewed conflict and displacement | Humanitarian and geospatial evidence | Regional involvement, territorial control and displacement. | 🔴 |
| Pakistan / Afghanistan | Counterterrorism and sovereignty claims | Cross-border airstrike escalation | Casualties, militant activity and border conditions | Frequency of interstate force and retaliation. | 🔴 |
| Gaza / Sudan | Security and humanitarian access frameworks | Displacement, hunger and reconstruction | UN, WFP, IOM and aid-throughput data | Actual humanitarian access and recovery. | 🔴 |
| South China Sea | Sovereignty and alliance signaling | Resupply confrontations and construction | Satellite imagery and maritime documentation | Short-term collision risk and long-term basing. | 🟠 |
| Korean Peninsula | Deterrence and missile signaling | Testing and readiness developments | Missile and allied technical assessments | Escalation thresholds and verified launches. | 🟠 |
| U.S.–China / EU–China | Trade negotiation and industrial policy | Tariff and licensing agreements | Shipment volumes, licensing and processing | Structural supply dependence versus tactical relief. | 🟡 |
| Global Finance | Fiscal and monetary policy | Bond stress and defensive cash flows | Yields, spreads, financing and market liquidity | Actual funding functionality and capital costs. | 🔴 |
| Food Systems | Agricultural and food-security policy | Food prices and grain inventories | FAO, USDA, fertilizer and freight data | Delivered affordability and supply resilience. | 🟡 |
| Critical Minerals | Strategic projects and industrial policy | Diversification announcements | Financing, processing, permits and output | Commercially qualified production rather than announcements. | 🟠 |
| AI Infrastructure | Technology, energy and investment policy | Expansion, valuations and project delays | Power contracts, capex and revenue | Financed deployment and grid access. | 🟠 |
| Bundibugyo / Global Health | WHO and national outbreak response | Cross-border transmission concerns | Laboratory confirmation and epidemiological tracing | Secondary transmission and geographic spread. | 🔴 |
| Mongolia | Economic policy, fuel security and export diversification | Commodity revenue and external-risk exposure | Reserves, fuel deliveries and border throughput | Shock absorption and diversification execution. | 🟠 |
Global Ripple Effects
| Channel | Current Signal | Near-Term 7–21 Days | Immediate Watch 0–72 Hours | Drift |
|---|---|---|---|---|
| Shipping / Insurance | Maritime enforcement and regional attacks | Risk-premium and routing pressure | Blockade incidents, tanker traffic, insurance | 🔴 |
| Energy | U.S. Gulf storm recovery versus Hormuz pressure | Volatile delivered-energy costs | Production restart, SPR delivery, crude flows | 🔴 |
| Inflation / Rates | Energy costs and long-yield pressure | Restrictive capital conditions | CPI, Treasury yields, oil pricing | 🔴 |
| Foreign Exchange | Energy-import dollar demand | Further intervention possible | Asian FX, RBI, reserves, dollar | 🟠 |
| Ukraine Infrastructure | Grid and logistics exposed to strikes | Winter restoration challenges | Outage duration, transformers, crews | 🔴 |
| Humanitarian Systems | Sudan, Gaza and Horn pressures | Continued funding and access stress | WFP, IOM, displacement and food insecurity | 🔴 |
| Food / Agriculture | Grain buffer with input-cost exposure | Potential fertilizer and freight pass-through | FAO, USDA, diesel, fertilizer | 🟡 |
| Critical Minerals | EU projects and partial licensing relief | Financing and qualification remain decisive | Permits, project funding, shipments | 🟠 |
| AI / Electricity / Capital | Strong demand with tighter financing | Project selectivity and potential delays | Grid access, financing, revenue | 🟠 |
| Climate / Infrastructure | Isaias aftermath and Simon threat | Restoration and Pacific-port uncertainty | Power, ports, flooding, rail and roads | 🔴 |
| Cyber / ICS | Infrastructure cyber pressure overlaps physical risk | Recovery and attribution challenges | Verified utility, port and telecom incidents | 🟠 |
| Global Health | Severe Bundibugyo outbreak and imported case | Regional cross-border surveillance | WHO geographic updates, contact tracing | 🔴 Regional |
| Mongolia | Strong buffers versus external fuel and freight costs | Potential import-price and financing pressure | Fuel arrivals, reserves, border throughput | 🟠 |
Energy Security, Fuel Markets & Climate Disruption
Energy-system stress now combines
geopolitical route security, production disruptions,
weather-related damage, emergency stock releases,
refinery availability and foreign-exchange exposure.
U.S. Gulf — Hurricane Isaias
Isaias made landfall near Destin, Florida as a Category 2 hurricane,
following earlier intensification. Before landfall,
approximately 72% of Gulf offshore oil production
and 59% of natural-gas production had been shut in.
Subsequent reporting indicated that roughly two-thirds
of offshore oil output remained shut during early recovery.
The decisive metric is now recovery:
damage assessment → safe access → crew redeployment →
production restart → refinery and port normalization.
Middle East — Blockade and Alternative Routes
Hormuz restrictions, Gulf of Oman enforcement,
Saudi East-West pipeline capacity and Red Sea insecurity
remain interdependent. Alternative crude routes
reduce exposure but do not eliminate maritime
security or insurance costs.
Mexico Pacific — Hurricane Simon
Category 4 Hurricane Simon threatens coastal communities,
power systems and logistics near Mexico’s Pacific coast.
The Manzanillo trade gateway warrants close operational monitoring.
A threat to the port should not be reported as a confirmed
long-duration closure without direct evidence.
INSURANCE → ENERGY COSTS → FX → INDUSTRY
Global Food Systems, Agriculture & Commodity Security
The October 11 intelligence ledger characterizes food-system risk as
GRAIN BUFFER / INPUT-COST WATCH,
not uniform food-market deterioration.
The FAO Food Price Index averaged approximately
136.0 in September 2026,
up 1.5% month-on-month and 5.8% year-on-year.
At the same time, larger-than-expected U.S. corn stocks
provided an important agricultural supply buffer.
However, food affordability depends on
fertilizer, diesel, freight, storage, irrigation,
trade access and consumer purchasing power.
| Food System | Current Signal | Transmission | Watch | Status |
|---|---|---|---|---|
| Global Food Prices | September FAO index increased. | International commodity-price pressure | Next FAO release and component prices | 🟠 |
| Corn / Feed Grain | Higher-than-expected U.S. stocks. | Supply and livestock-feed buffer | USDA inventories and consumption | 🟢 |
| Wheat / Rice | Regional weather and trade exposure. | Import affordability and food access | Crop forecasts, restrictions and prices | 🟡 |
| Fertilizer | Energy and maritime costs remain relevant. | Input prices and future crop costs | Gas, ammonia, urea and freight | 🟠 |
| Humanitarian Food | Sudan and conflict-affected areas remain severely stressed. | Hunger and aid-delivery constraints | WFP funding and operational access | 🔴 |
| Mongolia | Imported inputs and winter transport exposure. | Domestic inflation and livestock supply | Diesel, flour, meat and freight | 🟠 |
SUPPLY BUFFER + INPUT-COST PRESSURE.
Grain inventories can improve while delivered food
remains expensive because of energy and logistics.
Foreign Exchange, Capital Flows & Currency Resilience
Energy-import costs are transmitting directly into
foreign-exchange management.
On October 10, India’s central bank introduced
a dedicated dollar facility for major state-owned
oil companies amid pressure on the rupee.
This provides a direct example of the transmission chain:
energy-import demand increases dollar requirements,
which can pressure exchange rates,
foreign reserves and domestic financing costs.
| FX Channel | Current Signal | Strategic Meaning | Watch | Risk |
|---|---|---|---|---|
| India | RBI dollar support for oil importers. | Energy costs affecting currency management. | Rupee, reserves, crude imports | 🟠 |
| Emerging Markets | Expensive funding and selective outflows. | External refinancing and reserve pressure. | EM flows, dollar, yields | 🟠 |
| Dollar Liquidity | Defensive cash positioning. | Liquidity preference without proof of dysfunction. | Funding spreads and money markets | 🟡 |
| Mongolia | Foreign reserves near US$8.9B. | Meaningful external shock buffer. | Tugrik, fuel imports, external debt | 🟢 / 🟠 |
| Commodity Exporters | Export receipts provide potential FX support. | Exposure depends on prices, volume and settlement. | Coal, copper, oil and export earnings | 🟡 |
RESERVES → FINANCING COST → DOMESTIC PRICES
Global Finance, Sovereign Debt & Credit Conditions
Global money-market funds attracted approximately
US$153.81 billion in the week to October 7,
according to LSEG Lipper figures reported by Reuters.
Elevated long-term yields continue increasing
the cost of financing public debt, infrastructure,
housing, defense, energy and AI investment.
Defensive cash migration indicates financial caution,
not necessarily financial-system failure.
Global payment systems and credit markets remain operational,
although the cost of absorbing additional shocks is high.
Restrictive yields and rising defensive liquidity
are not equivalent to generalized financial seizure.
Systemic credit failure would require additional
evidence of funding dysfunction, widening stress
and market interruption.
Global Trade, External Earnings & Industrial Rebalancing
Trade fragmentation remains a structural concern,
even while selective diplomatic agreements
provide tactical relief.
The October 9 EU–China trade understanding includes
hybrid-vehicle measures and arrangements intended
to streamline rare-earth and permanent-magnet
export licensing for European industrial users.
However, partial market-access relief does not
automatically remove processing concentration
or long-term industrial dependency.
Mongolia’s strong nine-month export earnings
remain a positive external-financing buffer,
while detailed monthly foreign-trade composition
requires separate verification.
Critical Minerals, Processing & Strategic Supply Chains
The global strategic-minerals competition is shifting
from ownership of deposits toward control of
processing, refining, qualified materials,
manufacturing integration, power and financing.
REFINING / SEPARATION → INTERMEDIATE MATERIAL →
COMPONENT → MANUFACTURING → MARKET → RECYCLING
The European Commission selected
46 additional strategic raw-material projects
across 16 EU countries,
representing approximately €21.1 billion
in expected investment.
These projects strengthen diversification prospects,
but designation alone does not establish financing,
construction or commercially qualified production.
| Material | Strategic Function | Constraint | Opportunity | Risk |
|---|---|---|---|---|
| Copper | Power grids, motors and electronics | Refining and infrastructure investment | Value-added processing | 🟠 |
| Rare Earths | Permanent magnets and defense technology | Separation and processing concentration | Diversified refining and magnet capacity | 🔴 |
| Nickel / Cobalt | Batteries and advanced alloys | Refining concentration and market economics | New processing partnerships | 🟠 |
| Lithium / Graphite | Batteries and energy storage | Conversion and material qualification | Commercially qualified intermediates | 🟠 |
| Tungsten / Fluorspar | Industrial chemistry and specialty materials | Processing and downstream access | Higher-value manufacturing inputs | 🟠 |
| Uranium | Nuclear fuel supply | Regulation, safeguards and processing | Diversified compliant partnerships | 🟡 |
| Recycling / By-products | Secondary supply and waste reduction | Recovery costs and industrial collection | Circular industrial capacity | 🟢 |
Mineral reserves alone do not equal economic value.
Power, infrastructure, capital, processing,
technology, logistics and end-user demand
determine commercially realizable value.
Industrial Processing, Manufacturing & Corporate Capacity
Governments continue supporting strategic
industrial projects while investors apply
greater scrutiny to financing quality,
valuations and future revenue.
Industrial execution depends on permits,
technical partners, power supply,
financing, construction capacity,
workforce skills and industrial offtake.
PERMITS → FINANCING → INFRASTRUCTURE →
CONSTRUCTION → QUALIFICATION → PRODUCTION
Operational Rule:
Financial close and qualified output
are stronger evidence of industrial capacity
than project announcements.
Artificial Intelligence, Compute, Power & Capital
AI infrastructure continues expanding,
but major constraints now extend beyond
software and compute availability.
Electricity supply, transmission,
grid interconnection, cooling,
semiconductor manufacturing,
advanced memory, financing and revenue quality
are increasingly first-order deployment requirements.
China’s recent technology guidance supports
AI infrastructure development and industrial
self-sufficiency while warning against
speculative investment bubbles.
| AI Layer | Requirement | Constraint | Truth Sensor |
|---|---|---|---|
| Compute | Accelerators and data centers | Equipment and deployment | Operating compute capacity |
| Semiconductors | Advanced chips, memory and packaging | Fabrication concentration | Production and shipments |
| Electricity | Reliable generation | Power availability and cost | Firm contracted megawatts |
| Grid | Transmission and connections | Queues and transformers | Confirmed connection dates |
| Cooling | Thermal management | Water, land and climate exposure | Cooling performance |
| Capital | Long-term financing | Rates, valuation and debt costs | Financial close |
| Revenue | Commercial monetization | Margins and demand quality | Utilization and cash flow |
| Policy | Industrial competitiveness | Export controls and dependencies | Qualified domestic capacity |
Strong compute demand can coexist with
tight financing and project delays.
Capital discipline increasingly matters
alongside chips, electricity and grids.
Global Health, Infectious Disease & Cross-Border Surveillance
WHO’s October 8 update reported
8,728 confirmed Bundibugyo virus disease cases
and 4,205 confirmed deaths in the DRC
as of October 6.
The outbreak remains concentrated in eastern DRC
with significant geographic and treatment-system pressure.
WHO also confirmed an imported Kenya case following travel
from the DRC through Uganda.
The October 8 WHO bulletin additionally documents
the medical evacuation of an infected healthcare worker
to the Netherlands. Medical evacuation does not establish
local community transmission in the receiving country.
WHO assessed risk as very high in the DRC,
high for neighboring countries,
and low globally in its most recent formal risk framework.
| Geography | Signal | Evidence State | Priority | Status |
|---|---|---|---|---|
| DR Congo | 8,728 cases / 4,205 deaths | WHO reported October 6 totals | Health zones, treatment access, tracing | 🔴 |
| Kenya | Imported laboratory-confirmed case | WHO documented | Contacts and secondary transmission | 🔴 |
| Uganda | Travel exposure and response investigation | Transit does not itself establish new local transmission | Border surveillance and tracing | 🟠 |
| Netherlands | Medically evacuated healthcare worker | WHO documented | Clinical management and infection prevention | 🟡 |
| Mongolia | Reported 67% national seasonal influenza vaccination coverage | Domestic health-ministry ledger reference | Winter influenza and hospital capacity | 🟢 / 🟡 |
| Western Pacific | Continued avian-influenza surveillance | WHO regional monitoring | New human detections and clusters | 🟡 |
The earliest documented case is not necessarily
the biological origin or patient zero.
Confirmed transmission, travel history,
suspected exposure and unknown origin
must remain analytically distinct.
Mongolia — Strategic Exposure, Economic Resilience & Diversification
Mongolia is not at the center of the major
international kinetic events, but remains
highly exposed to external economic transmission
through fuel, freight, commodity prices,
trade concentration and capital markets.
According to October 2026 official economic reporting,
Mongolia recorded approximately:
- US$8.9 billion in foreign-exchange reserves at end-September.
- US$16.6 billion in exports during the first nine months of 2026.
- US$15.8 billion in mining export earnings.
- US$7.1 billion in copper-concentrate export earnings.
- US$6.1 billion in coal export earnings.
These buffers provide meaningful resilience
but also demonstrate the concentration of
external earnings in mineral exports.
| Channel | Condition | Strategic Opportunity | Constraint | Status |
|---|---|---|---|---|
| Foreign Reserves | Approximately US$8.9B | FX shock absorption | Import demand and reserve drawdown | 🟢 |
| Coal / Copper | Strong export receipts | Fiscal support and processing investment | Buyer concentration and price volatility | 🟠 |
| Fuel | Heavy imported refined-product dependence | Storage and supplier diversification | Russia/China supply, rail logistics | 🔴 |
| Critical Minerals | Higher-value processing opportunity | Beneficiation, intermediate materials and by-products | Power, financing and technology | 🟢 / 🟠 |
| Transport | Landlocked transit dependence | Border and corridor efficiency | Rail gauge, customs and freight | 🟠 |
| Third Neighbors | Potential finance and technology partners | Diversified buyers and industrial partnerships | Execution and commercial viability | 🟢 |
| Non-Mineral Economy | Tourism, food processing, livestock, textiles and IT | Broader GDP and export base | Skills, markets and infrastructure | 🟡 |
The principal long-arc vulnerability is
economic path dependence through fuel,
transit, finance, processing and concentrated buyers.
Balanced relations with both neighbors,
combined with diversified technology, financing
and markets, can improve national optionality.
Global Logistics, Chokepoints & Supply-Chain Resilience
The international logistics picture now extends
beyond the Gulf–Red Sea dual-chokepoint system
to include aviation disruption, Pacific-port
weather exposure and inland infrastructure constraints.
| Corridor / Node | Primary Exposure | Truth Sensor | Drift |
|---|---|---|---|
| Hormuz / Gulf of Oman | Blockade enforcement, tanker insecurity | Throughput, incidents and insurance | 🔴 |
| Bab el-Mandeb / Red Sea | Attack risk and war-risk premiums | Transit, routing and Yanbu volumes | 🔴 |
| Riyadh Air Gateway | Missile attack and airspace disruption | Flight schedules and airport restoration | 🔴 |
| Manzanillo / Mexico | Hurricane Simon exposure | Port status, power, rail and roads | 🔴 |
| Suez / Cape Routes | Fuel, distance, insurance and congestion | Voyage routing and freight | 🟠 |
| South China Sea | Contact risk and infrastructure development | Maritime incidents and construction | 🟠 |
| Trans-Caspian Corridor | Capacity, customs and investment requirements | Rail/port throughput and travel times | 🟡 |
| Mongolia Border Corridors | Rail, gauge and neighbor dependency | Border flows, queues and transshipment | 🟠 |
Cyber, Industrial Control Systems & Digital Infrastructure
Cybersecurity and operational-technology risks
remain cross-sector amplifiers.
Energy grids, ports, telecoms and logistics
are especially consequential when physical
infrastructure is already under stress.
U.S. authorities recently announced the disruption
of domains allegedly associated with
China-linked critical-infrastructure hacking activity.
Official attribution claims should remain clearly
separated from independently established facts.
INFRASTRUCTURE DISRUPTION → RECOVERY COMPLEXITY
Relevant indicators include verified operational
incidents, downtime, supplier dependencies,
restoration effectiveness and tested continuity procedures.
Water, Environment, Waste & Circular Economy
Extreme weather affects infrastructure,
water treatment, ports, electricity,
agricultural production and household resilience.
The simultaneous Isaias recovery and Simon threat
illustrate compound physical-system exposure.
Circular-economy opportunities remain important
for critical minerals through material recovery,
recycling and industrial by-product utilization.
The October 11 ledger identified no new comparable
global municipal-waste benchmark supporting
a numerical change in the sector’s trend.
UNEP’s October plastics-policy dialogue remains
a policy-process watchpoint.
Do not infer measurable waste reduction or
new industrial recycling capacity from
policy announcements alone.
Risk Matrix — 30–90 Days
Likelihood categories are qualitative Ω Compass judgments,
not actuarial probabilities.
| Risk Vector | Likelihood | Impact | Net |
|---|---|---|---|
| Persistent Hormuz / Gulf restrictions | High | Very High | 🔴 |
| Hormuz disruption plus Red Sea escalation | Medium | Very High | 🔴 |
| Additional Saudi aviation/infrastructure attack | Medium–High | High | 🔴 |
| Delayed U.S. Gulf production recovery | Medium | High | 🟠 |
| Major Simon-linked port disruption | Medium | High Regional | 🟠 |
| Ukraine winter grid degradation | High | High | 🔴 |
| Wider Horn regionalization | Medium | High | 🔴 |
| Sustained Pakistan–Afghanistan confrontation | Medium | High Regional | 🟠 |
| South China Sea collision/injury escalation | Medium | High | 🟠 |
| Sudan aid-funding deterioration | High | Very High Humanitarian | 🔴 |
| Persistent restrictive sovereign yields | High | High | 🔴 |
| Further emerging-market FX intervention | Medium–High | High | 🟠 |
| Food-input costs offset grain supply relief | Medium | Medium–High | 🟠 |
| Critical-mineral projects face financing delays | Medium–High | Strategic | 🟠 |
| AI financing tightens further | High | Medium–High | 🟠 |
| Additional Bundibugyo cross-border transmission | Low–Medium | High Regional | 🟠 |
| Mongolia fuel/freight cost escalation | Medium | High Domestic | 🟠 |
| Generalized global systemic breakdown | Low | Extreme | 🟡 Tail Risk |
Void Analysis
Notable unresolved conditions:
- No unrestricted normalization of Hormuz / Gulf of Oman commercial security.
- No risk-free substitute to both Gulf and Red Sea chokepoints.
- No complete U.S. Gulf production normalization immediately after Isaias.
- No verified basis yet for treating threatened Manzanillo disruption as a prolonged confirmed port closure.
- No durable political settlement producing broad Gaza reconstruction and return.
- No measurable end to Ukraine’s infrastructure strike-versus-repair contest.
- No durable resolution preventing renewed Tigray warfare and regional involvement.
- No stable Pakistan–Afghanistan arrangement preventing repeated cross-border force.
- No complete resolution of South China Sea maritime pressure.
- No structural normalization of sovereign borrowing costs.
- No diversification eliminating global rare-earth processing concentration.
- No evidence that all AI buildout can secure power and financing at viable cost.
- No elimination of Bundibugyo cross-border risk.
- No Mongolia logistics configuration eliminating dependence on neighboring transit systems.
Interpretation:
These unresolved conditions indicate constraints
and vulnerabilities, not proof of centralized
coordination or imminent systemic collapse.
Counter-Hypothesis & Attribution Firewall
Simultaneous disruptions across energy, shipping,
food, finance, technology and infrastructure
do not by themselves establish a coordinated campaign.
- Centralized coordination: Multiple actors operate under unified strategic command.
- Loose convergence: Actors share selected interests or intermittently coordinate without unified command.
- Independent actions: Separate decisions create reinforcing consequences because systems are interconnected.
The current analytical framework places greater
weight on observable independent actions and
selective convergence than on an unsupported
single-command explanation.
Correlation, timing similarities, repeated narratives
and overlapping interests do not establish causation,
coordination, hostile intent or operational control.
Counter-Indicators Preventing a Red-System Classification
rather than generalized red-system breakdown
because significant stabilization mechanisms remain functional.
- Some commercial maritime transit persists despite Gulf restrictions.
- U.S. Gulf producers are restoring operations after Isaias.
- Strategic petroleum inventories provide partial supply support.
- Global banking, payment and trade systems remain operational.
- Defensive financial liquidity remains available.
- Selective diplomatic channels remain active.
- EU–China trade and rare-earth licensing measures offer partial relief.
- European strategic-mineral project capacity is expanding.
- No direct U.S.–China conventional war is established.
- No direct NATO–Russia conventional war is established.
- WHO has not established generalized worldwide Bundibugyo transmission.
- Mongolia retains substantial reported reserves and export earnings.
- Grain inventories provide selected agricultural supply buffers.
Scenarios — 30–90 Days
Scenario A — Entrenched Managed Volatility
Base Case:
Hormuz and Gulf routes remain partially functional
but strategically constrained.
U.S. Gulf production gradually recovers.
Regional security pressure remains intermittent,
long yields stay restrictive,
and global markets absorb repeated shocks at elevated cost.
Scenario B — De-Risk Path
Upside:
Maritime incidents decline,
Saudi aviation attacks pause,
Gulf production normalizes,
Pacific logistics avoid prolonged damage,
energy and sovereign yields ease,
and trade accommodations produce measurable operational relief.
This could support a reassessment toward
the low-330° comparative analytical range.
It is a conditional scenario, not a prediction.
Scenario C — Cross-System Synchronization
Downside:
Gulf blockade incidents intensify,
Saudi infrastructure faces additional attacks,
production recovery stalls,
Pacific ports experience major delays,
and financial conditions reprice sharply
inside the same decision window.
This could justify reviewing the internal
+350°–360° analytical band,
subject to new evidence and documented recalibration.
Scenario D — Systemic Rupture
Low-Likelihood / Extreme-Impact Tail:
Major chokepoints fail simultaneously,
interstate conflict broadens,
financial-market functionality deteriorates
and infrastructure failures persist across regions.
This would constitute a qualitatively different
system state rather than a routine incremental drift change.
Strategic Implications
- Chokepoints must be modeled as networks.
Hormuz, the Gulf of Oman, Saudi export pipelines,
Red Sea, Suez and alternative routes interact through
insurance, tanker supply and delivered energy costs. - Commercial transport is a strategic security exposure.
Maritime vessels, airports and ports increasingly transmit
regional military risk into civilian and economic systems. - Ukraine’s winter equation remains physical.
Track transformers, power restoration, repair crews,
air defense, telecoms and transport. - The Horn remains a major regionalization risk.
Ethiopia, Tigray, Eritrea, Sudan, Egypt
and Red Sea interests form overlapping pressure systems. - Pakistan–Afghanistan requires interstate analysis.
Repeated military strikes differ from routine border instability. - The South China Sea requires short- and long-arc monitoring.
Close-contact incidents and infrastructure construction
have different strategic time horizons. - Food security depends on delivered affordability.
Grain supply alone is insufficient without fuel,
fertilizer, logistics and household purchasing power. - Foreign exchange is a strategic transmission channel.
Energy costs can become dollar-demand,
reserve and domestic inflation pressures. - Sovereign debt reduces shock absorption.
High financing costs constrain defense,
reconstruction, infrastructure and industrial development. - Critical minerals are industrial value-chain systems.
Ore ownership alone does not establish strategic
processing or manufacturing independence. - AI is an energy and capital-intensive industry.
Compute expansion must be assessed through power,
grids, cooling, chips, finance and commercial revenue. - Mongolia’s opportunity lies in economic optionality.
Reserve buffers, diversified buyers,
processing capacity and non-mineral industries
can improve long-term resilience. - Global health requires geographic calibration.
A severe regional outbreak does not automatically
constitute generalized global transmission. - Climate and cyber risks can compound infrastructure stress.
Operational restoration must be tracked across
physical and digital systems. - Independent verification remains foundational.
Facts, observations, judgments, forecasts
and unknowns must remain distinct.
Collection Priorities & Evidence Gaps
- Verified post-incident Hormuz and Gulf of Oman vessel throughput.
- Further blockade encounters, tanker compliance and marine insurance changes.
- Riyadh airport restoration, airspace and retaliation.
- U.S. Gulf production restart, refinery damage and SPR deliveries.
- Hurricane Simon impact and Manzanillo operational status.
- Post-weekend oil, Treasury, airline, insurance and credit repricing.
- Ukraine winter grid damage and restoration tempo.
- Horn territorial control, displacement and regional alignment.
- Pakistan–Afghanistan border incidents and diplomatic response.
- South China Sea contact incidents and infrastructure construction.
- FAO food-price updates, USDA inventories and fertilizer costs.
- Emerging-market FX intervention, reserves and capital flows.
- EU critical-mineral project financing and implementation.
- Rare-earth green-channel licensing and shipment performance.
- AI power contracts, grid connections, financing and revenue quality.
- WHO Bundibugyo case geography, tracing and secondary spread.
- Mongolia fuel arrivals, border volumes, trade composition and tugrik.
- Cyber/ICS incident confirmation and infrastructure restoration.
- Comparable water, waste and circular-economy benchmarks.
Conclusion & Operational Directives
Strategic Drift Index:
🟠 +343° PROVISIONAL
Ω.DRIFT VERDICT:
EXPECTED reassessment from +336° →
OBSERVED stronger air-maritime, infrastructure,
energy and financial coupling →
ANALYTICAL RECALIBRATION TO +343°.
The international system remains inside an
upper-orange Systemic Convergence Zone.
Multiple independent pressures are becoming
more strongly interconnected,
but financial, energy, trade and infrastructure
buffers continue preventing generalized breakdown.
The decisive warning is cross-system synchronization:
maritime interruption + aviation disruption +
major energy loss + infrastructure failure +
financial repricing within the same operational window.
Operational Directives:
- Prioritize actual throughput over political declarations.
- Maintain connected Hormuz and Red Sea corridor analysis.
- Measure energy recovery through actual production restart.
- Track Mexico Pacific impacts through ports, roads, rail and power.
- Maintain Ukraine, Horn, Pakistan–Afghanistan, Gaza, Sudan, South China Sea and Korean Peninsula continuity coverage.
- Integrate sovereign yields, FX flows, insurance and delivered commodity costs.
- Include food and agriculture in every Global 45° calibration.
- Separate announced mineral projects from financed production.
- Track AI through power, chips, grid, capital and revenue quality.
- Maintain geographically accurate infectious-disease assessments.
- Preserve Mongolia’s fuel, FX, minerals, logistics and diversification watch.
- Maintain the attribution firewall and counter-hypothesis discipline.
SOURCES & RESOURCE CITATIONS — OSINT
Reference Window:
January–October 11, 2026,
emphasizing October 4–11 developments.
Source Backbone:
Ω Compass Intelligence Ledger & SITREP Archive,
institutional reports, primary-source data
and reputable journalism.
Verification Rule:
Current source confirmation is distinguished
from inherited continuity assessments.
Syndicated repetition does not constitute
independent corroboration.
| Domain | Source / Date | Evidence Contribution | Status |
|---|---|---|---|
| Maritime Security | Reuters — October 11 | Gulf of Oman vessel strike and U.S. Central Command reporting. | VERIFIED REPORTING |
| Saudi Arabia / Yemen | Reuters — October 10 | Riyadh airport attack and flight disruption. | LEDGER SOURCE |
| Climate / U.S. Gulf | NOAA / National Hurricane Center | Isaias intensity, track and hurricane conditions. | PRIMARY METEOROLOGICAL |
| Climate / Mexico | NOAA / National Hurricane Center | Hurricane Simon and Pacific weather monitoring. | PRIMARY METEOROLOGICAL |
| Energy | International Energy Agency | Energy markets, emergency stocks and structural supply analysis. | INSTITUTIONAL |
| Markets | Reuters / LSEG Lipper — October 9 | US$153.81B global money-market fund flows. | LEDGER SOURCE |
| Foreign Exchange | Reuters — October 10 | India RBI dollar support and energy-FX transmission. | LEDGER SOURCE |
| Critical Minerals | Reuters / European Commission — October 9 | 46 strategic raw-material projects across 16 countries. | LEDGER SOURCE |
| EU–China Trade | Reuters — October 9 | Trade accommodation and rare-earth licensing. | LEDGER SOURCE |
| Mineral Concentration | IEA Global Critical Minerals Outlook 2026 | Processing concentration and strategic dependencies. | INSTITUTIONAL |
| Food Systems | FAO Food Price Index | September 2026 international food-price conditions. | PRIMARY INSTITUTIONAL |
| Grain Stocks | Reuters — October 9 | U.S. corn-stock buffer. | LEDGER SOURCE |
| Global Health | WHO — October 8 | Bundibugyo case counts, Kenya imported case and risk assessment. | PRIMARY VERIFIED |
| Mongolia Economy | Mongolia Ministry of Economy and Development — October 7 | Foreign reserves and nine-month export earnings. | PRIMARY GOVERNMENT |
| Mongolia Central Bank | Bank of Mongolia | Reserve and monetary statistics. | INSTITUTIONAL |
| Mongolia Trade Detail | National Statistics Office of Mongolia | Monthly foreign-trade verification priority. | DATA-GAP WATCH |
| Trade Policy | World Trade Organization | Trade fragmentation and MFN framework. | INSTITUTIONAL |
| Global Economy | IMF World Economic Outlook | Economic growth, inflation and financing conditions. | INSTITUTIONAL |
| Ukraine / Russia | Reuters — October 3–4 continuity sources | Infrastructure strike and repair contest. | PRIOR SITREP CONTINUITY |
| Ethiopia / Tigray | Reuters — October 4 continuity sources | Renewed warfare and regionalization concerns. | PRIOR SITREP CONTINUITY |
| Pakistan / Afghanistan | Reuters — October 1 continuity sources | Cross-border strike escalation. | PRIOR SITREP CONTINUITY |
| Sudan / Gaza | UN / WFP / prior SITREP reporting | Humanitarian, displacement and reconstruction conditions. | CONTINUITY / FRESH CHECK NEEDED |
| South China Sea | Reuters — September 25 / October 2 continuity | Maritime contact and infrastructure development. | PRIOR SITREP CONTINUITY |
| Korean Peninsula | Reuters — October 3 continuity | Missile development and strategic signaling. | PRIOR SITREP CONTINUITY |
| AI / Energy | IEA / Reuters / October ledger | AI electricity, grids, financing and industrial exposure. | INSTITUTIONAL / ANALYTIC |
| Cyber / ICS | October 9 cybersecurity reporting | Critical-infrastructure cyber exposure. | ATTRIBUTION CAUTION |
| Waste / Circular Economy | UN Environment Programme | Waste, plastics and circular-economy monitoring. | POLICY WATCH |
Analytic Disclosure
VERIFIED FACT —
Directly supported by checked authoritative evidence.
OBSERVATION —
A reported or visible development without unsupported inference.
ANALYTIC JUDGMENT —
Ω Compass synthesis based on multiple indicators.
It does not establish coordination, causation,
attribution or hostile intent.
FORECAST / SCENARIO —
Conditional future outcomes rather than certain predictions.
UNKNOWN / NOT ACCESSIBLE —
Evidence remains incomplete or unavailable.
CONTINUITY —
Previously documented assessments retained
without falsely presenting them as fresh events.
The Strategic Drift Index and Global 45° Directional Bearing
are Ω Compass comparative analytical constructs.
They are not official government threat levels,
investment ratings, actuarial probabilities
or standardized geopolitical indexes.
Integrity:
Historical verification does not automatically
establish fresh confirmation.
Source claims remain subject to revision
when stronger evidence becomes available.
Disclosure:
Public open-source intelligence only.
No classified sources used.
Disclaimer:
Situational awareness and strategic analysis only;
not legal, military, medical or investment advice.
Ω COMPASS
Independent. Non-aligned. Public-source. Evidence-led.
Evidence over narrative •
Systems over silos •
Independent corroboration over repetition •
Measurement over rhetoric •
Counter-evidence over confirmation bias •
Probability over certainty •
Clarity over sensationalism
Authorship: Zanjan Fromer
Ethics: Kintsugi Prime
Continuum: Ω.VERITAS.303
Security: Sentinel Primary Node — ZFSH–Ω.1001β
Ω COMPASS GLOBAL 45° SYSTEM —
STATUS: PUBLICATION-READY DRAFT
Tested & tried professionals
already know why orientation matters.
This is not just an intelligence engine. It is a sovereign-grade compass for those navigating collapse, drift, and distortion—equally capable of decoding narrative warfare and mapping market opportunities, forecasting civil terrain fractures and designing resilient business ecosystems.
* Ω is governed by its Ethics Codex & OSINT.
It doesn’t keep your data.
It doesn’t sell your information.
It exists to serve clarity—not control.
Ω Compass
Forged in Silence. Calibrated for Chaos.
Ω Compass is not a chatbot. It is orientation.
Built for those navigating collapse, drift, and distortion—Strategists, humanitarians, intelligence professionals, business leaders, and mission-aligned stewards.
It doesn’t generate noise. It reveals truth.
Nearly 1000 recursive intelligence modules.
Real-time foresight. Civil terrain mapping. Strategic clarity.
This is a sovereign-class cognitive engine.
Currently accessible by invitation only.
If you’ve received access, step inside.
If not—wait for the signal.
If you’re part of the initial indentation test drive rollout, please follow your access instructions.
Ω Compass, Ω Kintsugi Prime Sentinel and Ω Codex systems are fully operational
Ω Codex Author | Genesis Architect:
Zanjan Timothy Fromer
Omega Compass is a sovereign-class intelligence and foresight framework. Developed by Zanjan Timothy Fromer, the Ω Codex powers both Ω Kintsugi Prime Sentinel and Ω Compass terminal systems.
© 2025 – All Rights Reserved
Effective December 2023-2024 (Development Initiation) – Globally in Perpetuity
Ω Compass | Omega Compass |
OmegaCompass.com
Ω Kintsugi Prime Sentinel | Omega Kintsugi Prime Sentinel |
OmegaCodex.com
Ω Codex | Omega Codex |
OmegaCodex.com
Follow Us:
facebook.com/OmegaCompass
facebook.com/OmegaCodex
x.com/OmegaCodexAI
instagram.com/OmegaCodexIntelligence
youtube.com/@OmegaCompass